
Hey Doctors! I know by now you must be getting comfortable with the features of Dentostack that you use daily, so let me help you understand a less frequently used feature that is yet very powerful to keep track of your clinic’s growth. You must have seen features like Appointments, Patients, Medicine, Statistics and MediaHut. Today, I will take you through the usage of statistics and show you how it helps you understand the growth of your clinic. I will also show you how to get a detailed report of your income from the clinic.
Dentostack’s Statistics
The statistics module includes both the Graphs and Reports sections. You can easily get a complete picture of your cases and the cash flow of the clinic with just a few clicks. Let’s look further into these sections.
Graphs: It helps understand data easily
Graphs make data easier to understand by visually highlighting patterns and trends. Dentostack provides two types of graphs i.e., Case Summary and Transaction Summary. Both graphs have some specific use cases which we will explore one by one.
Case Graph
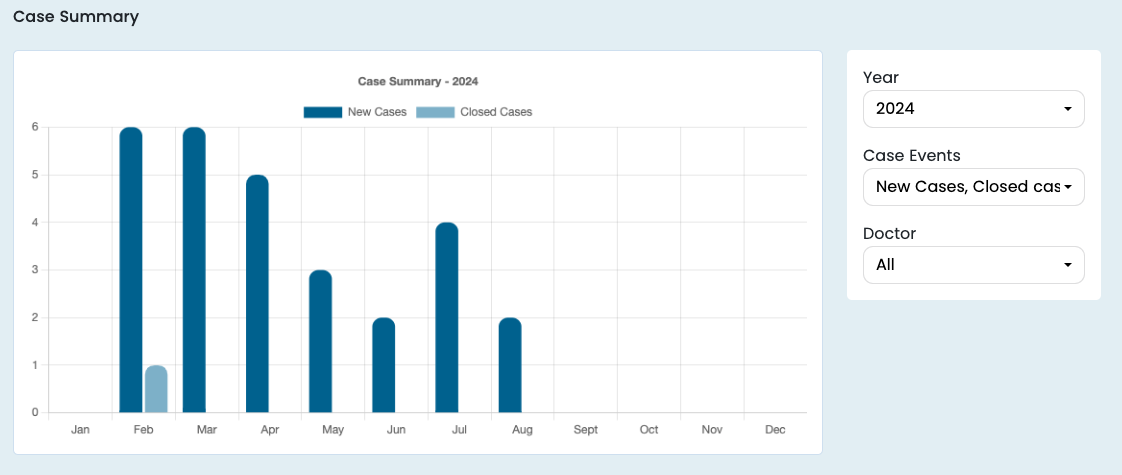
It is a graphical representation of the number of new cases added and closed in a given month.
The graph which represents the number of new cases started each month helps you understand the effectiveness of the organic reach of your clinic as well as any marketing effort taken by you for your clinic. It can also help identify months that are colder so that they take necessary steps to ensure a steady flow of patients in those months.
The graph which represents the number of cases that get closed each month, gives an insight into your operational efficiency. A high percentage of closed cases indicates an efficient workflow, whereas a low percentage points to inefficiencies in case management.
Transaction Graph
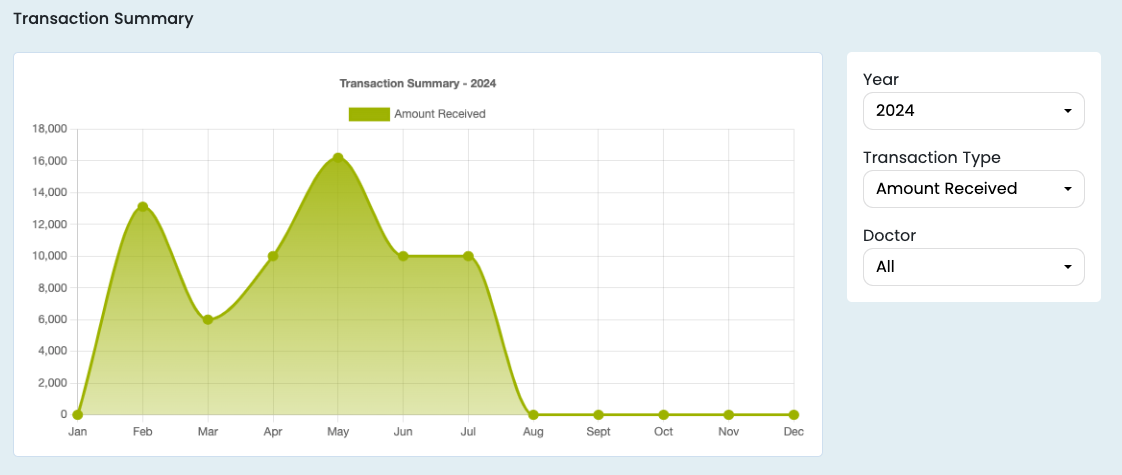
This is a graphical representation of the total amount received in each month. This allows the doctors to visualize their monthly income as well as compare it with the other months. Doctors can use this data to estimate and budget for impending expenses, as well as create reasonable goals for themselves.
Reports : It presents data in readable format
Reports are helpful when you need to understand the data in detail with more precision. Dentostack has three types of reports, i.e., Transaction Summary Report, Transaction Detailed Report Patient Due Report. First two reports provide information about the clinic’s cash flow and the last tell about the due amount with the patients.
Summary Report
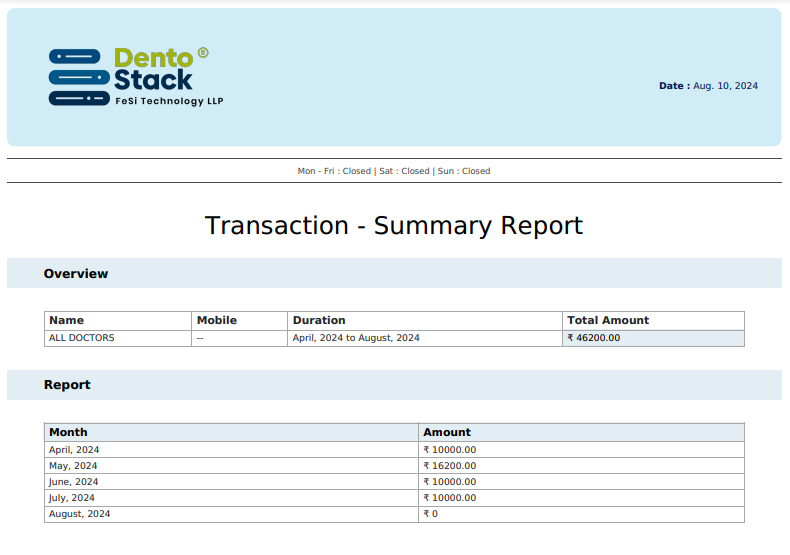
This report shows the total amount collected in each month in a tabular format starting from the provided start month and year till the provided end month and year. This report can be generated at the clinic level as well as for a specific doctor. The latter use case is very helpful when the doctor is a consultant and it is required to know the exact amount collected by the clinic for the cases handled by that doctor.
Detailed Report
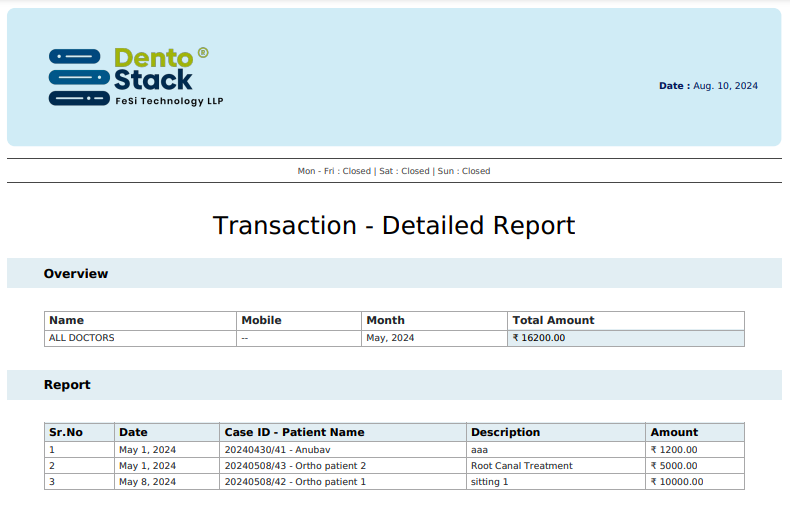
This report provides an in-depth view of all financial transactions for a given month allowing doctors to analyze the data and they are able to map each transaction with the patient’s case. Important details such as the transaction date, transaction description and total cost are included in this report.
Patient Due Report
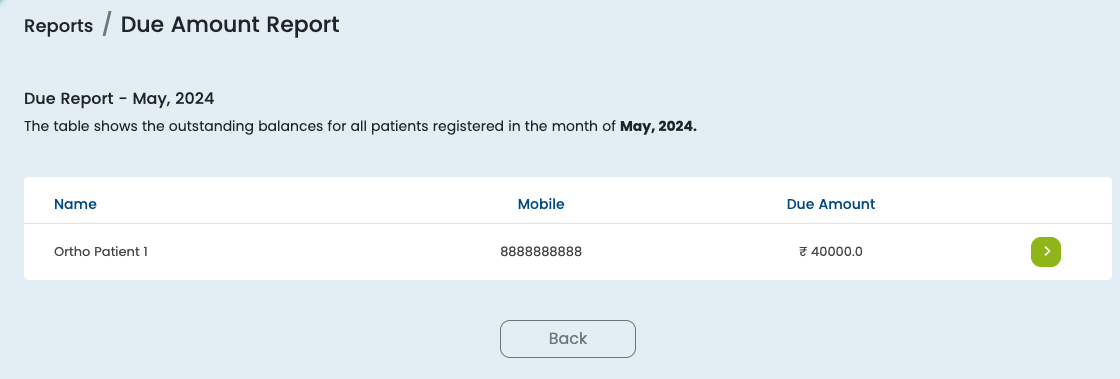
This report provides a list of all patients with outstanding amounts who got registered in a given month. The doctor or staff of the clinic can use this patient list to remind patients about the due amount and plan systematic follow up to encourage timely payments. Dentostack also supports sending notifications via SMS to remind patients about their due amount.
Key Highlights
- Using Graphs, you can easily compare the performance of the clinic with previous months.
- You can identify seasonal trends and patterns as to which month you have an increase in the number of cases and accordingly use this information for planning promotional campaigns and marketing during slack periods.
- With just a glance, you can know the details of each patient with outstanding payments, and assess the overall health of your financial performance.
So what are you waiting for? get started with Dentostack and take advantage of the Statistics module to keep track of your clinic and with this you get a comprehensive picture of your clinic’s operations and financial information to accelerate the growth of your clinic.
Know more about Dentostack
Visit dentostack.com to know more about dentostack and its services.
About the Author

Ekta Arya, Content Writer at Dentostack, is a versatile person who also works as a soft skills and communication trainer. She handles everything while enjoying exercise, yoga, reading, movies, and music.